

In this section
By analysing data from various sources and using Machine Learning algorithms, the system can automate demand forecasting, thereby optimising procurement and purchasing operations as well as improving production processes.
Objectives
- Make predictions that provide operational insight into the future
- Provide a decision-support tool for management
- Provide business knowledge during the analysis phase
Knowing the demand for a product/service has always been a very important factor in all businesses, from local shops to large logistics, energy, etc. companies. The transition from business decision-making based on “hunches” was replaced by data analysis carried out in spreadsheets, and has now been surpassed by the implementation of “Machine Learning” algorithms, which are able to automate and perform all these calculations at scale.
What we do
After gaining a detailed understanding of the business and the specific characteristics of its data, we carry out exploratory analyses to determine which algorithms and configurations are suitable. Using both univariate and multivariate methods, we can forecast time series for consumption, production, or expenditure. These are integrated into ETL processes, and the algorithms that deliver the best results are selected through an iterative process that can be automated using heuristic rules.
How We Do It
Exploratory analysis
We analyse data quality and visualise the information in multiple ways (line plots, scatter plots, histograms, box plots) to identify what is most valuable, validating it with the client’s business knowledge.
This stage is carried out using Python’s pandas library.
Algorithm selection
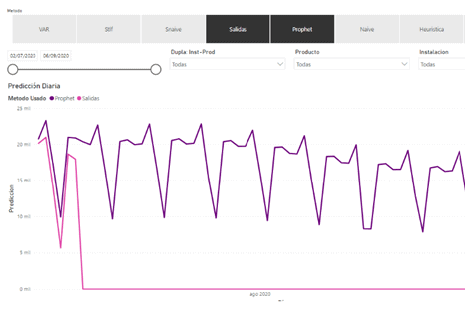
We have algorithms (Naive, SNaive, HoltsWinter, STLF, Forecast, VAR, Prophet) already implemented, or we implement new ones if necessary (for example, LSTM-type neural networks). The algorithms are validated using error metrics to select the most suitable one.
Data exploitation
We create a dashboard to visualise the results, configured and tailored to the client’s needs and requirements, enabling them to make data-driven decisions.
If necessary, we also implement the heuristic rules used to reselect algorithms/configurations.