Skip to content

ADVANCED ANALYTICS SERVICES

BUSINESS INTELLIGENCE CONSULTING

Turn your data into a competitive advantage

At LISDATA, we help companies obtain relevant business data that improves decision-making, making it more strategic and effective.nnOur approach is not limited to data visualization. At LIS, we offer Business Intelligence consulting and development linked to data activation, from integrating multiple sources to creating advanced analytical models to detect opportunities, competitive advantages, and optimize processes.

Why LISDATA in Business Intelligence

At LISDATA we are experts in developing and implementing BI solutions adapted to each project and industry. Business intelligence can be used by organisations of every size and sector, from small and mid-sized companies to large corporations.

We work with an end-to-end approach

Our BI solutions are built on a solid base and architecture, connecting data engineering, data governance and predictive models.

Artificial intelligence and BI

To go beyond visualisation and reporting, we connect business intelligence with AI models, including machine learning, NLP and computer vision.

Technology flexibility

We work with the main business intelligence products, such as Power BI, Tableau or Qlikview, without imposing our own technologies or creating lock-in, so the client always stays in control.

An agile challenger

We stand out for fast delivery, close communication and direct involvement of our team from day one.

A focus on mid-sized and large companies

We work with all kinds of industries, from logistics, transport and retail to education. We are the right partner for companies that prefer to focus on their core and delegate their analytics, offering data analytics outsourcing with continuous expert support.

We offer adapted solutions

Not every tool is the same, nor do they offer the same features or cost the same. We help you identify areas for improvement and opportunity in your business and understand its needs better.

LISDATA

Business Intelligence Services We Offer

We transform Business Intelligence into a real competitive advantage, creating customized solutions with tailored services according to each business’s needs. We design strategies that intelligently integrate data into all key business processes and aspects, transforming all this valuable information into concrete actions that drive business growth.

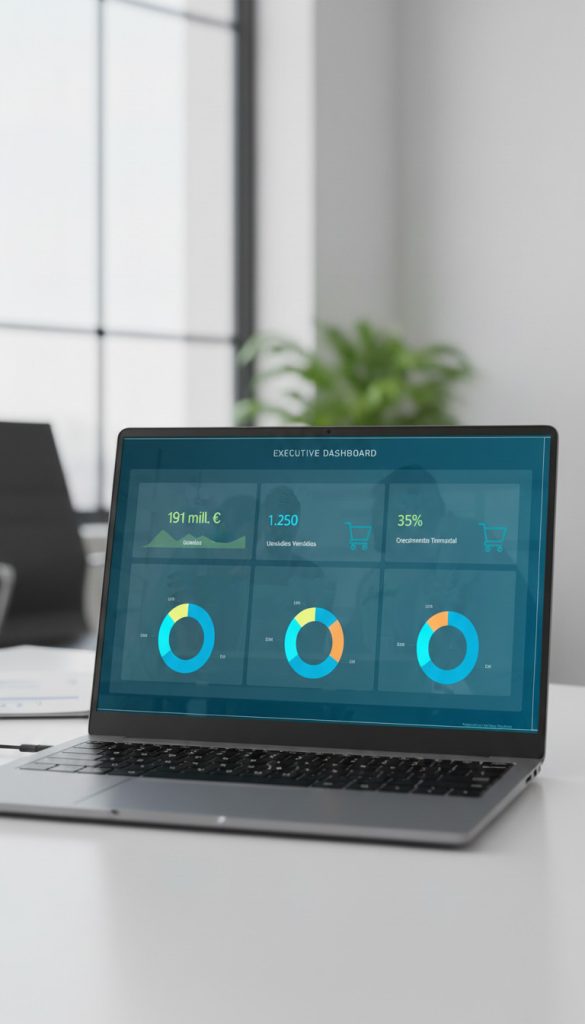
Implementation of Executive Dashboards

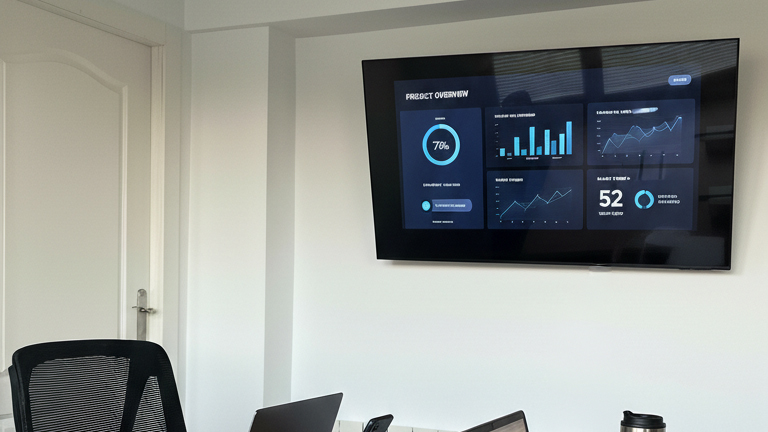
We design custom executive dashboards that clearly display the most important information for your business in real time. With these panels, decision-making will be faster and more confident, based on real data and current trends.

Integrated Dashboards and KPI Reporting

We create integrated dashboards that group information from different areas and departments in one place, facilitating continuous monitoring and KPI reporting. These dashboards enable constant updates and much faster detection of opportunities and improvements.

Data Warehouse and Dimensional Modeling

We create solid and well-organized data warehouses, using dimensional modeling to ensure your data is always in order. This allows you to access information agilely, perform quick queries, and simplify even the most complex analyses.

Self-service BI with Power BI, Tableau, and Qlik

We offer self-service BI solutions. We train internal teams to process and analyze data and generate reports autonomously using tools like Power BI, Tableau, and Qlik. This service reduces dependency between departments and third parties and streamlines daily tasks.

Integration with Operating Systems / ERP

We connect BI software with your internal systems and ERP so data flows automatically from the source to the analysis tool. This ensures accurate information, eliminates manual tasks, and provides real-time insights directly from your company’s key systems.

Success story: customer segmentation for Inkolan and INNOLAB

Inkolan, a company that supplies digital information about public utility networks, needed to understand the data on the downloads its customers made on its platform. The goal was to improve strategies, analyse market fluctuations and identify customer trends and patterns for a better service.

To do this, LISDATA carried out a data quality study to have a base to work on.

After that, data from the last year was analysed, such as dates, monetary value and download frequency.

Python was used as the programming language, and Power BI was used to visualise the data and create panels to control and monitor every kind of customer, making control much simpler, for example at invoicing level, by grouping customers by rate type.

Creating a classified customer segmentation later made it possible to launch much more effective, optimised targeted marketing campaigns.

Success story: HR management for the Servicio Cántabro de Salud

The Servicio Cántabro de Salud needed to move its current Qlik Sense operation to other business intelligence tools. From LIS, an architecture based on Azure technology was designed from several data sources, to produce visualisation reports in Power BI for the human resources team.

This gave them an architecture ready to extend the data warehouse, a view of active contracts and employee absenteeism, and control of staff costs.

Fast visualisation in Power BI made management of the human resources department much more efficient, and the information more controlled and available at any time.

Business intelligence solutions we offer

Some business intelligence examples that have helped different companies scale and improve are:

Development of a control tower for a company that produces and sells canned fish and seafood

The company had no way to see its sales data and its profitability, so it needed a dashboard with reliable data for decisions. From LIS, a control tower was developed in Power BI that updates automatically once a day, with 3 modules: sales, profit and customer analysis. From that control panel the company could:


  • Develop a data warehouse with sales data.
  • See its sales, credit notes, unusual charges, raw-material costs and profit by customer and product.
  • Have a monthly view of how sales and profit evolve compared with the selected previous year.
  • Run a customer analysis showing recurrence and average ticket.

Development of a data warehouse and visualisation dashboards for a dealership group

The company needed all the group’s data in one place. The data they had was not of high quality: outdated information and inconsistent data. Azure services were configured to build a data warehouse architecture focused on generating Power BI dashboards and on integrating other information systems, allowing the company to:


  • Improve end users’ ability to analyse.
  • Improve data quality from the different sources.
  • Create a targets policy based on the quality of customer data.
  • Cut time spent on maintenance and looking for information by up to 90%, about 40 hours a week.
  • Cut the workload of data scientists and data analysts by up to 40%.
  • Use customer data correctly when contacting them (data protection).
  • Bring the data together in one place.

Tools and technologies we use

What is business intelligence? BI is the use of strategies and tools that turn a company’s raw data into information and knowledge. Its aim is to improve decision-making and turn the company into an intelligent business.

There are different types of business intelligence:


  • Descriptive analytics: describes and shows what has happened in the company with historical data and reports.
  • Exploratory analytics: used to explore the data and detect patterns, trends and relationships between them.
  • Prescriptive analytics: actions are recommended based on predictive data analysis and simulations.


To get the most from the data and information companies hold, they need the best business intelligence tools:


  • Data integration and architecture tools: Oracle BI, SAP BI, Microstrategy, Pentaho, Sisense, Looker, Azure, Databricks and our LLMs.
  • Data visualisation and analysis tools: Power BI, Tableau, Qlikview, ThoughtSpot.
  • ETL and data engineering tools: Spark.

Business intelligence and business analytics tools centralise and unify data, ensuring its quality, its traceability and access control. They provide interactive dashboards, corporate reporting and exploration of KPIs and trends, driving faster, data-based decisions.

FAQs about Business Intelligence

What is the difference between Business Intelligence and Data Analytics?

Business Intelligence focuses on organizing and displaying data to understand what is happening in your company. Data Analytics is broader; in addition to that, it analyzes and seeks to predict what might happen and recommend what to do with that data.

Power BI or Tableau: Which is better for a medium-sized company?

For a medium-sized company, Power BI is usually the best option, as it is more economical, easier to use, and integrates well with other Microsoft tools. Tableau is powerful and a good option for handling large amounts of data, but its licenses are more expensive and it is less developer-friendly.

What is needed to implement BI from scratch?

It is advisable to seek the help of a business analytics consultancy like LIS. The consultancy will help you define business objectives, design the data architecture, select appropriate tools, ensure data quality, and support the creation of dashboards and team training.

How to ensure a BI project delivers ROI?

The main goal is to establish clear indicators from the outset, aligning the project with business objectives and measuring improvements in efficiency, cost reduction, or revenue increase. Additionally, continuous training and monitoring help everyone benefit and make the investment worthwhile.

Approximately how much does a BI project cost?

It largely depends on the company size, project complexity, data volume, and the business analytics tools used. It can range from a more economical price for simpler solutions to much higher figures for more comprehensive solutions. The important thing is that the investment translates into clear benefits for your business.

Transform Your Data into Decisions

As organizations move towards digital transformation, they handle and process more data than ever before. This makes BI techniques increasingly necessary.nnUse business intelligence for decision-making, gaining competitive advantages, and driving your company towards a Data-Driven philosophy.