
QLIK SENSE VS TABLEAU (Part I)
A comparison of two major Business Intelligence tools for logistics.
Once we enter the world of Business Intelligence and want to make the most of our business data, we must consider which technology best fits our requirements.
If we take a look at the Gartner Magic Quadrant:
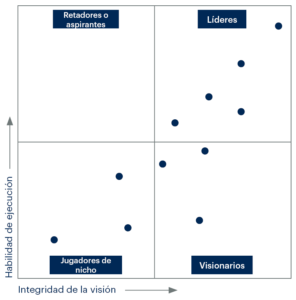
We see how the leading technologies in Business Intelligence are Qlik and Tableau, so this post is based on a comparison of the main benefits of each.
In this first post, we will talk about Qlik’s flagship tool: Qlik Sense, and in the second part, we will delve deeper into Tableau.
I hope this helps you in your decision.
QLIK SENSE
This business intelligence technology has a discovery platform capable of meeting most business requirements, while also providing a “Storytelling” section that allows us to create reports in a very simple and dynamic way.
Its main usability feature is based on creating visualizations using the well-known “drag-and-drop” method, so the interface is adapted for users who do not require a high level of programming and simply want to create their own indicators without any assistance from IT.
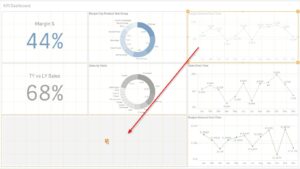
Responsive Business Intelligence: Visualization from any device
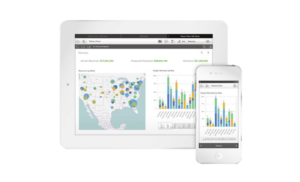
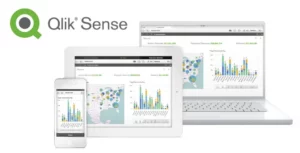
Users can share their visualizations through various mechanisms and from any type of device (computer, tablet, mobile, etc.), as they are developed in HTML5.
Furthermore, it is worth noting that Qlik Sense is responsive (meaning the same dashboard does not need to be resized for viewing on different devices), so when creating applications, programming focused on this is not necessary (to a certain extent).
Associativity in Business Intelligence
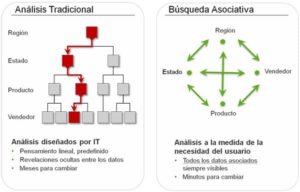
The powerful feature that differentiates Qlik from other BI technologies is its associative data engine. While other tools require an ETL (extraction, transformation, and loading) process prior to data loading, in this case, Qlik has a loading process enabled that allows you to perform all types of transformations on our data. Additionally, we can connect to almost any type of database without prior manipulation.
Thanks to this associative feature, when making selections in our dashboard, all indicators change instantly based on that selection; no matter which selection we start with, associativity means there is no need to follow any type of hierarchy for data visualization. Currently, there is no other Business Intelligence tool on the market with this feature.
Qlik Sense is available in two versions: Qlik Sense Desktop, which is free and runs on the Windows desktop, and Qlik Sense Enterprise, which runs on a server and provides users with a browser-based interface.
Both have similar functionality, but Qlik Sense Enterprise offers other collaboration possibilities: it provides Streams, which are groups of users with permissions for specific applications (dashboards), more personalized administration, and options so that end users do not have access to the internal programming of the dashboard, making the front-end user-friendly and very easy to use.
With this version of Qlik, the aim is to achieve secure, unambiguous data governance where the right people can always access the data prepared for them when they need it.
New visualizations: Other different and powerful chart types
There is also a specialized platform (Qlik Branch), where users themselves develop a large number of available APIs to create new types of visualizations: other charts, indicators, speedometers, etc.
On the other hand, Qlik Sense does not possess any statistical analysis or advanced prediction capabilities, as that is not its domain. What-If analyses can be incorporated, but it does not yet have any type of alerting implemented. Companies looking for a production notification platform should look elsewhere, as should users who only need simple charts, as they would find Qlik Sense to be overkill.
Qlik Sense Features:
- Fast and compatible with a level of data discovery that probably no other platform has.
- With an associative engine that allows us to start discovering from any point we choose. It is extensible and modular, making it easy for users to know which applications they can access.
- For any device and “responsive,” accessed via a web interface.
- Supports and covers the requirements of any type of business.
- Easy to use and govern.
- It possesses features such as:
- Bookmarks, where we save the selections we need to make daily so that the dashboard is ready with a single click.
- Storytelling, to tell stories and generate reports.
- Image capture, where we directly export the visualization we need, with the appropriate level of detail.