
ELK – How to handle real-time data?
ELK environment: Real-time data handling
After our first post, in which we introduced our real-time data analysis project, we move on to describing the tools and resources required.
As is obvious, the key element in this project is the data, and for that we decided it would be real and that we could validate and understand it. This is how we decided to monitor data from two cars in circulation. Fortunately, capturing data in passenger vehicles is very easy using the OBDII protocol.
Protocol for extracting data: OBDII
OBDII is an on-board vehicle diagnostics system. This system has been available in a wide range of vehicles since around 1996 in the United States. In Europe, this system was installed in 2000 for petrol vehicles, in 2003 for diesel vehicles, and in 2005 for trucks. Thanks to this device, today we can access the sensors and data of any vehicle whose manufacturing date is later than those mentioned above. This system is very useful for IoT.
Real-time data analysis: ELK
The other most important part of this project is being able to capture the data, analyse it, and finally display it. For this, we use the ELK environment, presented in the previous post: Elasticsearch + Logstash + Kibana.

Following the diagram above, after creating the log (record), the next phase is data capture (collection, processing, and storage). For this we will use Logstash, a tool capable of collecting logs, modifying them according to our needs, and then sending them to the database. Thanks to this tool, we can send the logs created by the car to a database in the format that best suits our needs.

In a second stage we will use Elasticsearch. It combines a search engine and a database that we will use to store the data processed by Logstash. The two distinguishing features of this database are that it is distributed and the high search processing speed it can achieve. This combination makes it ideal for real-time analytics projects.
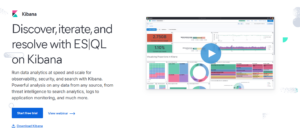
As a final step to display the data, we decided to use Kibana. Kibana is an Elasticsearch plugin that provides graphical visualisation of the data stored in the Elasticsearch cluster. In this way, individual charts or complete dashboards can be created. In addition, thanks to the refresh function, the data can be viewed updated to the second. It is a graphical and intuitive interface, so anyone on the business side has full autonomy to generate their own visualisations according to their needs, without having to rely on IT.
This is how the ELK environment (Elastic Stack, as it is called in English) is created, enabling us to obtain graphical representations of data captured in real time.
Business Intelligence and the art of visualisation
In the next post, we will explain how to create charts using Kibana, as well as how to create our own dashboard.
We look forward to seeing you in the next post—are you going to miss it?