
Comprehensive stock management with intuitive and simple dashboards
We live in a fast-paced world where every second counts. The digitalization processes we are experiencing across all sectors have accelerated even the most routine activities, such as shopping, gathering information, or communicating. Our environment is increasingly demanding regarding time ratios due to two main factors: first, the need to satisfy desires, resolve problems, and provide answers immediately; and second, the daily pace to which we are subjected leads to an endemic lack of time.
We fight this race against the clock in both private and professional spaces, where the necessary speed we mention has found a significant ally in data. While our world is fast, it is also full of information that we can now collect, process, and use to our advantage in real time.
In the industrial field, our main sector of activity, both time and information are crucial and closely linked. Consequently, all efforts focus on increasing both: gaining production and reaction time for decision-making, and leveraging data to optimize processes that lead us, closing the circle, to achieving that much-desired time.
Demand Forecasting
To see this more clearly, let’s look at an example. We will focus on the benefits of demand forecasting systems—specifically Purchases—to streamline industrial processes throughout the supply chain, gaining and even anticipating time and, consequently, improving productivity and profitability.
Demand forecasting tools allow us to predict future sales, greatly simplifying work, primarily in the warehouse, with a subsequent impact on the rest of the business chain. Much like having a crystal ball, if we know the future demand for our inventory, we can adapt stock to our needs, avoiding overstocking and dreaded stockouts. In this way, the risk of loss due to obsolescence is eliminated, space is saved, customer service is improved, decision-making becomes simpler and more accurate, tied-up capital is avoided, and a long list of benefits directly impacts business profitability.
To achieve this goal, in very simplified terms, it is necessary to capture data generated both internally (ERP, IoT, CRM, activity history…) and externally (calendars, weather, market…), process it with predictive algorithms, and translate it into a very simple and visual language. This allows us to check stock status and immediate and future needs at a single glance, gaining the precious time we lack. Let’s look at it with real screenshots.
Purchases
In the specific case of Purchases, we can very simply and visually check the descriptive situation of our historical purchases by product and supplier at a glance, identifying the delay ranking for each of them.
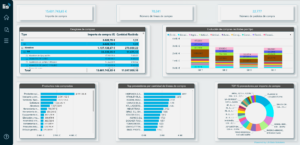
As shown in Figure 1, all necessary information regarding purchases is found in a single space: an intuitive and dynamic dashboard that displays the number of orders, purchase lines, actual average Transit Time, percentage of lines on time, delivery delay days, purchase evolution, most purchased active products, purchase evolution by product, supplier ranking by delay, and quantities ordered per supplier. In other words, all useful information for order management is located on a single screen, updated in real time.
Sales
Sales are reflected in the same way. In this case, based on the monitoring of key indicators, we can access the descriptive report of historical sales by product and market, indicating the best-selling assets.
The information shown in this case includes global sales evolution, sales evolution by product, best-selling active products, best-selling active products by market, sales distribution by market, number of sales orders, number of sales lines, and service days. Again, the information is concentrated on a single dynamic screen that allows us to capture all the records we need for daily management at a single glance.
Inventories
Purchases also shows the inventory status, taking into account turnover based on sales, with an ABC/XYZ classification of all product references.
As seen in Figure 3, five graphs show the ABC/XYZ stock dispersion, current ABC/XYZ stock, current stock by market, active/blocked stock, and non-sellable stock. Meanwhile, data highlights include average consumption, stock turnover, stock days, current stock quantity (sellable and non-sellable), and stock date.
Forecasts + Purchase Suggestions
Finally, let’s look at the dashboard dedicated to demand forecasting, which includes an automated purchase suggestions section to facilitate team workflows and simplify decision-making.
In this dashboard, we can see, as a milestone of particular relevance, the sales forecast by reference and purchase suggestions (bottom right corner) for those products at potential risk of a stockout. This critical information is accompanied by consumption/forecast evolution, projected stock evolution, sales by product and market, consumption/forecast evolution by market, and a 60-day order summary.
More planning time, less decision time
As we can see, demand forecasting tools—specifically Purchases—offer all the necessary information on purchases, sales, inventory, and the forecast of future events, with automated purchase suggestions and parameterizable alarms to simplify and improve decision-making.
Mapping out the roadmap for warehouse teams is now much simpler, as detailed information is available not only regarding history and current status but also what will happen in the future. Procurement and stock management tasks are consequently much more efficient, as only the stock expected to be sold is acquired or produced, avoiding the risks inherent in overstocking and stockouts. Furthermore, this impacts the entire supply chain, as Production, Marketing, Finance, and Logistics will base their actions on the demand forecast for references, collectively gaining efficiency, profitability, and the time we referred to at the beginning of the post.
As we noted, businesses that base their stock management strategy on demand forecasting systems have more reaction time and more time for purchase planning, while spending less time on decision-making, which becomes much simpler. They also have much more information available in dynamic, simple, and intuitive panels to optimize processes throughout the supply chain, also gaining in profitability and competitiveness.
In summary, returning to the two constraints set out in the first lines of the post, demand forecasting systems gain planning time and reduce the time spent—which we lack—on analysis and decision processes.