
Carbon footprint calculation for companies: transform your chaotic Excel files into an agile and traceable system
An increasing number of companies need to measure and report their emissions with greater rigor, yet many continue to rely on scattered data and manual processes. This development by LISDATA allows for the organization of information, automation of its processing, and the consultation of key indicators in a clearer and more consistent manner.
Calculating carbon footprint requires agility and rigor
Companies need reliable data on their carbon footprint to respond to clients, advance their environmental commitments, and prepare their operations for a more demanding regulatory context.
In sectors such as logistics and transport, the need to report emissions with greater precision can arise from both regulatory requirements and direct requests from clients who wish to know the impact associated with their operations. In this scenario, responding with agility no longer depends solely on having data, but on having it well-structured and ready for exploitation.
A development that transforms scattered data into useful and traceable information
The difficulty in calculating carbon footprint usually lies not in the absence of data, but in how it is organized. In many companies, the information already exists but remains spread across extensive, non-homogeneous Excel files that are highly dependent on manual reviews, which slows down analysis and complicates traceability.
To address this challenge, LISDATA has developed a platform oriented toward the calculation and visualization of carbon footprint based on the operational data of a company in the logistics and transport sector. The objective was not merely to automate a specific task, but to transform a disorganized information base into a system prepared to work with greater agility, consistency, and traceability.
Overall, this is a development designed to centralize, clean, and exploit shipment data that was previously managed in a fragmented way. The tool allows for the conversion of unstructured files into a homogeneous information base, the consultation of key emission and activity metrics, access to the details of each shipment, and the segmentation of information by client, site, or user profile.
Database, web application, and Power BI dashboards
The development is supported by an architecture composed of three main elements:
- Database, to structure and store information in an orderly manner.
- Web application, from which files, their processing, and data access are managed.
- Power BI dashboards, which allow for the visualization of key indicators and facilitate their analysis.
This structure makes it possible to move from a logic based on difficult-to-maintain spreadsheets to a more robust system, prepared for consulting information, detecting patterns, and working with much greater traceability.
Automatic cleaning and normalization of Excel files
One of the most relevant elements of the development is the processing of source data. The platform allows for the uploading of the Excel files the company already uses and applies an automated process of cleaning, sorting, and normalization.
This makes it possible to correct inconsistencies, unify criteria, and reorganize records that were previously scattered or in different formats. The result is a homogeneous information base, much better prepared for emissions calculation and subsequent analysis.
Consultation of indicators by client, site, and shipment
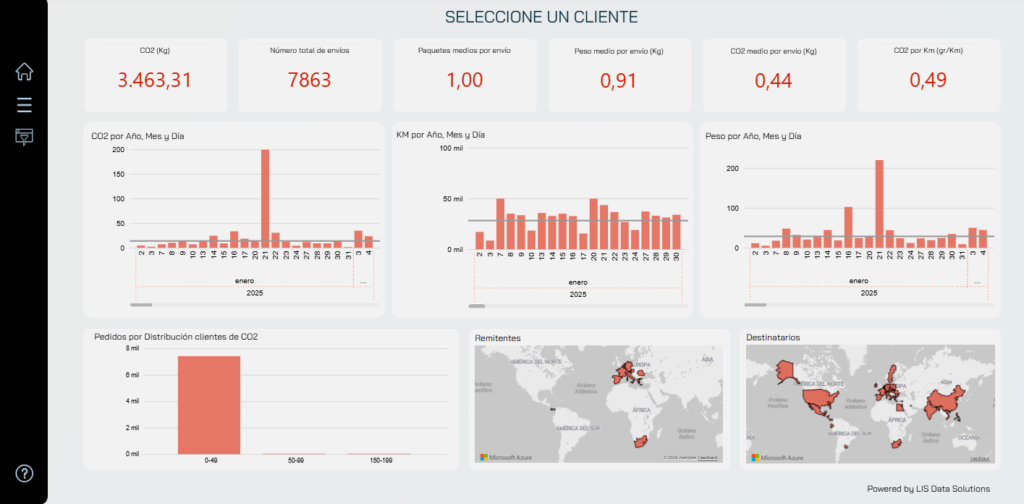
Once the information is processed, the platform presents a visual interface designed to facilitate both general consultation and more detailed analysis. In the main view, the user can quickly access the most relevant activity and carbon footprint indicators through summary boxes, time charts, distributions, and maps. This allows for the interpretation of data without having to manually reconstruct information or review scattered files.
The data offered by the system includes:
- Total CO2 (kg)
- Total number of shipments
- Average packages per shipment
- Average weight per shipment (kg)
- Average CO2 per shipment (kg)
- CO2 per kilometer
- Temporal evolution of emissions, kilometers, and weight by year, month, and day
- Distribution of orders based on different emission ranges
- Origin and destination of shipments, represented geographically
The tool is not limited to offering an aggregated view; it also allows for the division of information according to the company’s operational logic. If the company serves different clients, the platform makes it possible to consult data in a segmented manner for each of them, so that their specific activity and associated impact can be analyzed. In turn, this same information can be reviewed by site or in a consolidated manner, which facilitates comparing behaviors, detecting differences between centers, and obtaining a more complete view of the overall operation.
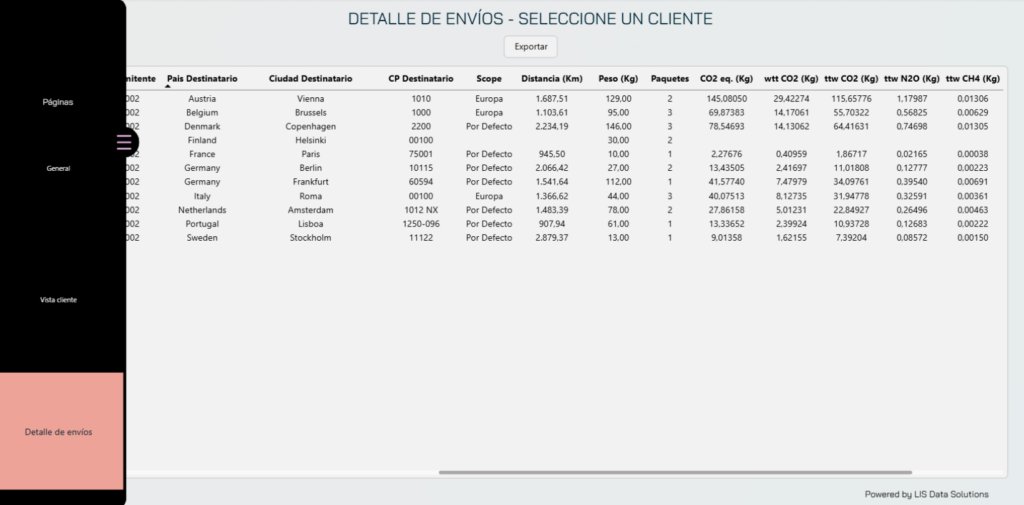
Furthermore, the system incorporates a shipment detail view with a tabular structure, aimed at those who need to drill down into specific data. At this level, fields such as sender, destination country and city, postal code, scope, distance traveled, weight, number of packages, and associated emissions are shown, along with other broken-down calculation parameters. This detail layer is especially useful for reviewing specific records, exporting information, and responding to specific requests with a higher level of precision.
On the other hand, the system relies on the GHG Protocol as a reference for structuring the emissions calculation. It is not just about organizing data, but doing so on a widely used and recognized methodological basis.
Why choose LISDATA to calculate your company’s emissions
At LISDATA we develop data and artificial intelligence projects aimed at converting the daily operations of logistics and transport companies into useful, traceable information prepared for decision-making. In an environment where routes, shipments, clients, sites, and consumption generate large volumes of data, this approach allows for the addressing of emissions calculation with a more orderly, consistent, and easy-to-exploit base.
Our value proposition for these types of projects is based on several points:
- Experience in data and automation, key to structuring complex operational information.
- Developments tailored to the reality of each company and focused on business and results.
- Specialization in medium and large companies in industry, logistics, and transport with real needs for traceability and reporting.
- End-to-end support, with direct involvement of expert profiles from the initial analysis to the implementation of the development.
In addition to carbon footprint calculation, at LISDATA we work on other artificial intelligence and advanced analytics developments applied to logistics, transport, and industrial operations, including:
- Corporate AI agents and LLM models
- Production planners
- Predictive maintenance for machinery and vehicles
- Slotting optimizers
- Transport route planners
- Purchases: intelligent purchasing platform
- Suppl-AI Chain Manager: supply chain management
LISDATA has 13 years of experience during which it has consolidated its activity in the field of data and artificial intelligence applied to business. Founded in 2013 in Vitoria, the company has a presence in Spain and Germany: a structure that reinforces its capacity to support companies from different sectors with a close, specialized, and results-oriented approach. Shall we talk?