
7 Steps to Predict Customer Churn with KNIME
Today we know that acquiring a new customer is between 6 and 7 times more expensive than maintaining one. For this reason, one of the main tasks in managing a customer portfolio is retention.
The importance of retaining your customers
Data analysis indicates that the sectors with the highest incidence of churn rate are Telecommunications, Press, and Energy. This is mainly due to business models based on temporary or subscription contracts. Furthermore, it is estimated that 68% of customers who switch companies do so because they have received poor service.
Currently, thanks to advances in computing and the constant recording of thousands of transactions, customer containment is much more efficient. In fact, some research indicates that an increase in customer retention rates of just 5% increases profits by between 25% and 95%, and that growing companies prioritize customer success more than those that are stagnant. Ultimately, we must use the information they provide us to reduce the churn rate, identifying it first, grouping churning customers according to their profile, and understanding the causes of this detachment in order to establish action protocols and thus avoid losing the customer.
So, how do we retain our customers?
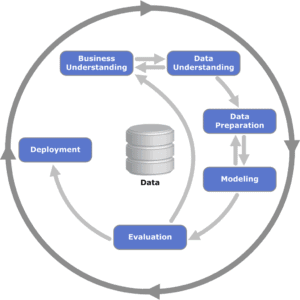
The answer is through predictive customer churn algorithms. To do this, we work with the CRISP-DM (Cross-Industry Standard Process for Data Mining) methodology, which, through a hierarchical process consisting of several tasks, offers your organization the necessary structure to obtain better and faster results in data mining.
- Business Understanding
- Data Understanding
- Data Preparation
- Modeling
- Evaluation
- Implementation or Deployment
- Visualization
To carry out this entire process, we use the KNIME tool, which offers the complete Data Mining cycle. With the ability to connect to multiple and heterogeneous data sources, we can unify data from different databases, files, and various web services such as Azure, etc., with very little effort.
With a wide variety of nodes for preprocessing, the tool offers optimal conditions for generating automated ETL processes. Finally, it offers the main algorithms and evaluation methods for generating powerful models. Additionally, it has multiple extensions (Text Processing, Big Data with Spark and Hadoop, Deep Learning with TensorFlow and Keras, and many more) that empower the tool even further.
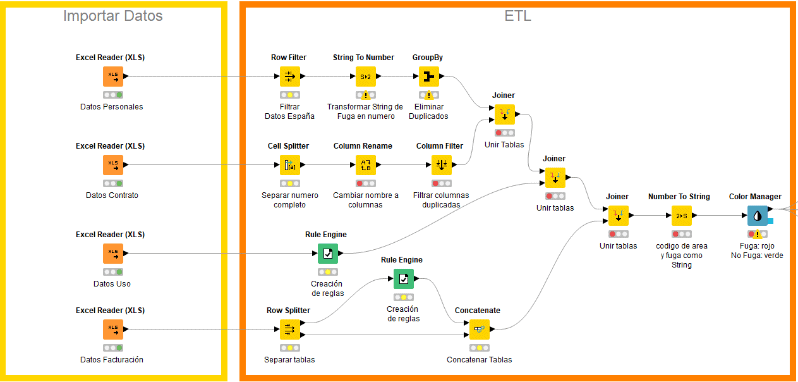
In short, through KNIME we can perform all the processes divided into the seven points set by the CRISP-DM methodology, which we will see below through a real project:
Business Understanding
The general mission of this phase is to understand the project objectives and requirements from a business perspective and convert this knowledge into the definition of a data mining problem and a preliminary plan to achieve the objectives.
We start with a company in the Telecommunications Sector, with a type of contract for its customers that does not require permanence. On the other hand, customer fluctuation is very strong, with many entries and exits every month. The objective of this project is customer retention through predictive customer churn algorithms.
Data Understanding
In this phase, the main objective is to perform an initial capture of the data to be analyzed to become familiar with it, identify quality problems, detect subsets of data that could be interesting for formulating specific hypotheses to be validated later with the analysis, and even identify the first keys to the knowledge that can be extracted from the data.
For this case, the available data are as follows:
- Personal data with marked churn (ERP System)
- Contracting data (ERP System)
- Usage data (Usage Monitoring System)
- Billing data (Billing System)
Data Preparation
Once the data has been selected, it moves to the data preparation phase. Data preparation, often called “preprocessing,” is the stage in which raw data is cleaned and organized for the next phase of processing. During preparation, raw data is checked for errors. The goal of this step is to remove erroneous data (redundant, incomplete, or incorrect data) and begin creating quality data.
For preparation, KNIME allows the integration of multiple data sources (SQL databases, Excel, CSV, Webservices/APIs).
- ERP, Monitoring, and Billing Systems Data
Furthermore, it has a large number of functions to transform data:
- Filter by country, group by customer, remove duplicates, calculations and additional fields, etc.
To facilitate our work, it features visual and intuitive workflows:
- Drag & Drop functions, visible connections, etc.
Modeling
Data modeling is a way of structuring and organizing data so that it can be easily used by databases. It is commonly used in combination with a database management system. Data that has been modeled and prepared for this system can be identified in several ways, such as according to what they represent or how they relate to other data. In KNIME, we have an extensive library of advanced analytics:
- Classification algorithms (Churn Yes/No) for predicting customer churn.
Evaluation
This step evaluates the degree to which the model responds to business objectives and determines if there are any business decisions that the model does not cover. Another evaluation option is to test the model on test scenarios. The evaluation also verifies other results generated by data mining.
The objective is to summarize the evaluation results in terms of business success criteria, including a final statement establishing whether the project has achieved the initial business objectives.
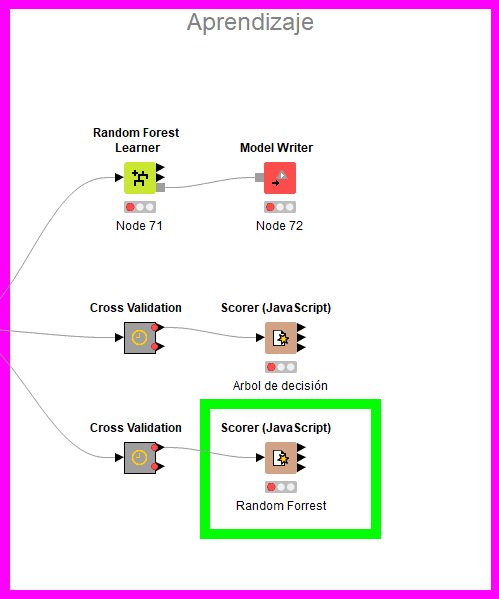
Evaluation and comparison of algorithms through cross-validation:
- We train the Random Forest and Decision Tree with 80% of the data and apply them to the remaining 20%, verifying the results.
Algorithm selection and export of the trained model:
- Random Forest, with a 93% accuracy rate, has the highest reliability, so we select this one.
Deployment
The creation of the model and its positive evaluation do not mean the end of the project. The knowledge acquired through the data mining process must be organized and presented in a way that is usable in the business context. This involves integrating the models into the organization’s decision-making processes, as well as requiring customer involvement in the model’s operational implementation steps.
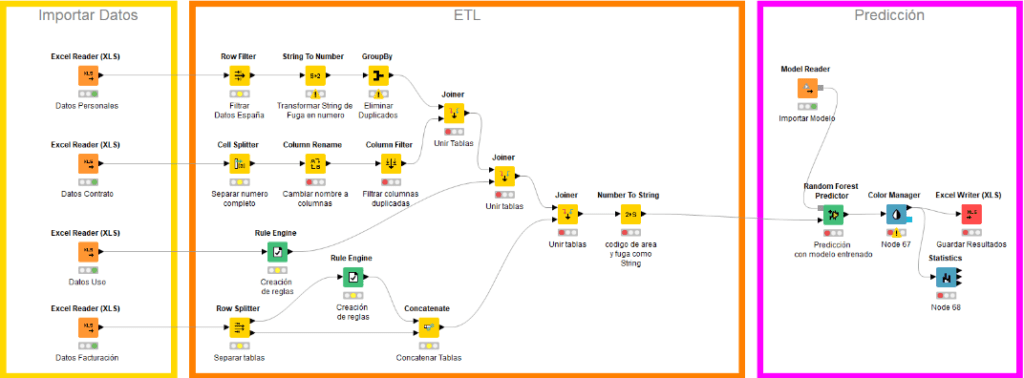
Workflow for prediction:
- The workflow connects to the data sources and extracts the newest data to predict future customers who are going to end their contract.
Workflow automation:
- With KNIME Server, you can automate your workflow, allowing it to run up to several times a day without human action.
Integration of results into the process:
- The team responsible for customer retention receives the results and directs retention actions toward customers with a high probability of churn.
Reduction of customer churn by up to 30%.
Visualization – Business Intelligence
The results can be integrated into an intuitive Business Intelligence dashboard. In this way, the customer retention team can analyze the situation in detail and derive a powerful strategy to prevent customer churn.